
You are here
Analyzing IMLS Data to Find Your Peer Libraries
Posted by Jim Craner on April 1, 2019
"Peer analysis" is a tool used in finance, management, and even sports -- and you do it unconsciously all the time. We're simply finding the similar items in a large dataset by one or more dimensions, and then seeing how they compare in other dimensions. In other words, if you're the director of a small library in Ruraltown, Nebraska, you don't want to compare your library's collection numbers to those larger library systems in Omaha and Nebraska.
The Institute of Museum and Library Services actually provides an online tool that you can use to compare your library to others of similar size, budget, and other key values. However, there are a couple of important caveats for using this service:
- the "peer" cohorts returned can number in the hundreds, which can make it difficult to find specific key examples or very close matches
- the service is from the IMLS "Labs" beta service, which means the government could shut it down at any time.
Because of these caveats, especially the last one, we've created our own searchable interface for the IMLS data, using the FY2016 Public Library Survey data. We can easily update this when FY2017 data is released, and we're not reliant on increasingly at-risk IMLS funding to be able to access the data. You can access our interface at https://galecia.com/library-data-finder.
Essentially, we want to use our own library's data as the "control" and then use searching and filtering to narrow down the list of libraries until we have the number of peers that we desire.
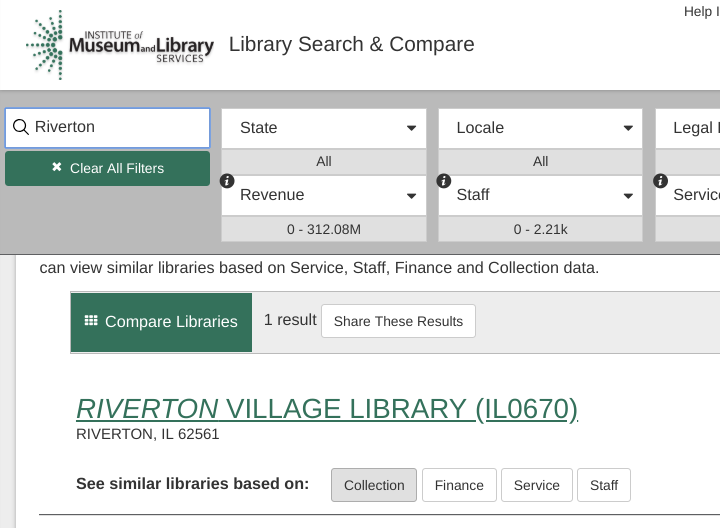
As you can see in the first screenshot, the search filter allows us to search for a specific library and view its data. We can also "see similar libraries" based on four main data variables: collection statistics, finance and budget data, service figures, and staffing figures.
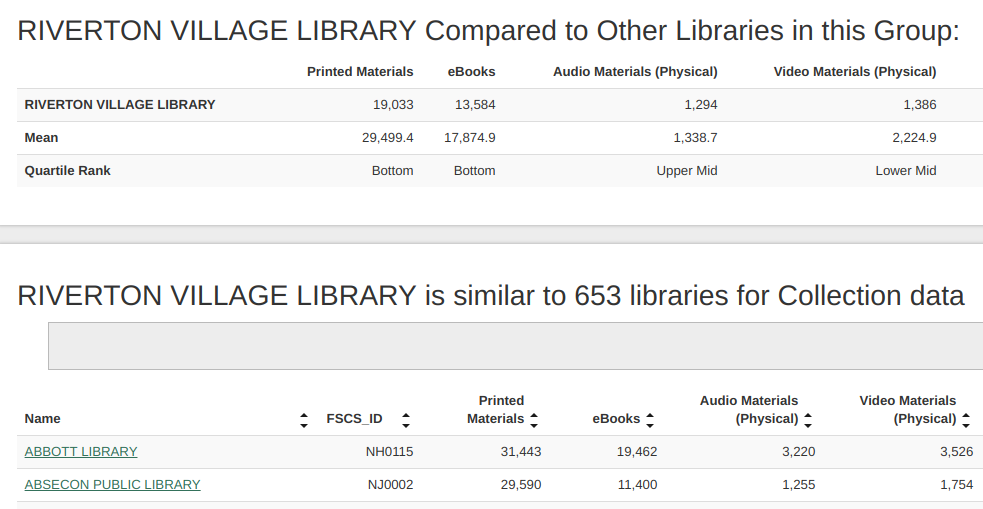
The second screenshot shows the comparisons -- as you can see, there are over 600 libraries in our peer "cohort" that IMLS has generated. You can download this data to analyze it for a quantitative analysis -- but if you're trying to do a qualitative analysis of a smaller number of libraries, that large number is unhelpful. Instead, we want to focus our search to only return libraries that more closely match our target library's stats.
To easily narrow down a smaller peer cohort, we'll switch over to Galecia's Library Data Finder and begin entering search parameters that explicitly match our target library's statistics -- plus or minus a small fudge factor. That fudge factor, or search range, will determine the size of our cohort. In the search screenshot below, you can see that we've put in ranges for a few parameters. Our target library's revenue is $75,000/year, so we're searching for libraries with similar revenues between $68,000 and $82,000 (our initial 75,000 target plus or minus about 10 percent). Since our target library has approximately 11,500 annual visits, we're searching for libraries with visits between 10,000 and 13,000 per year (again, approximately plus or minus 10 percent).
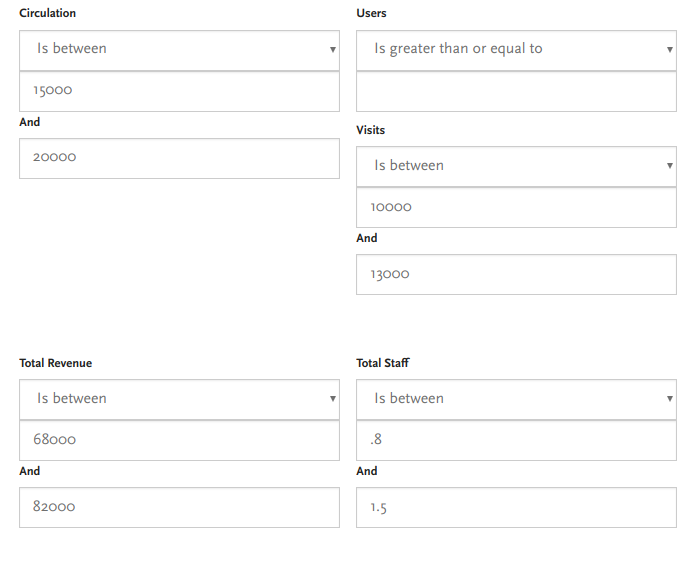
By the time we've entered four search parameters in this example, we've narrowed the 10,000 public libraries in the US down to just a half-dozen libraries that closely match our library in the four most important dimensions. It's important to note that this is an iterative process - you'll need to tinker with the search parameters to enter values that match what you're looking for. In other words, if you run a library with a large population area but smaller-than-relative-to-peers budget, you can look to see how you compare with similarly-resourced libraries in various inputs and outputs based on what you're hoping to find. So in our example above, if we used 20% margins fo our search ranges instead of 10%, we'd have a much larger cohort to analyze.
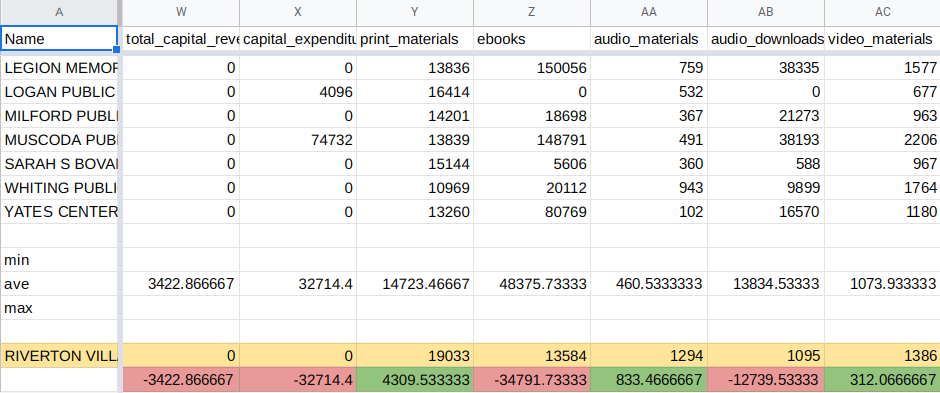
And of course the Data Finder tool allows us to export our data for other use. We can map the data by location or, more likely, import it into a spreadsheet program for further analysis. For example, a bit of conditional formatting in Google Sheets, as in the screenshot below, illustrates how our library compares to the average library within our very small 6-library cohort group.
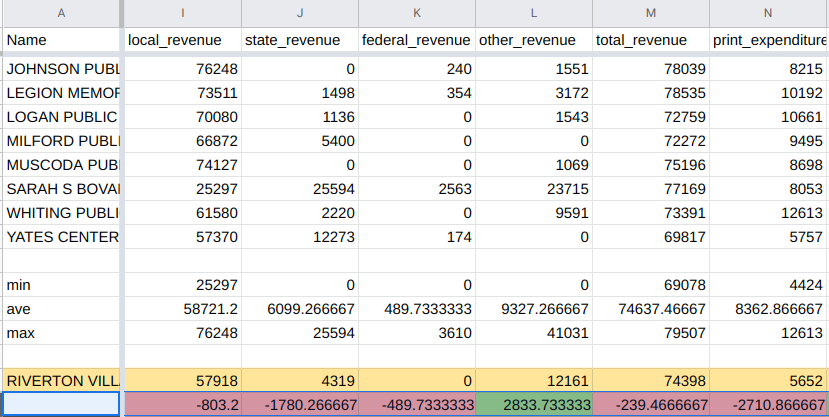
I've put our target library's numbers in orange, then used our spreadsheet's MIN, AVERAGE, and MAX functions to show the averages and range for values in each column. For every column where we beat the average, we color the column green; for values below average, we use red. This presents a quick visual guide to what dimensions we need to address. In the screenshot above, showing revenue columns, you can see our target library receives lower-than-average funding in all categories except "Other" (due to a one-time fundraising spike and grant at the target library).
Let's examine some other columns. In the screenshot below, you can see that our target library outperforms well in collection statistics, with 4300 print materials over the average for the cohort, and 800 audio materials over the average baseline.
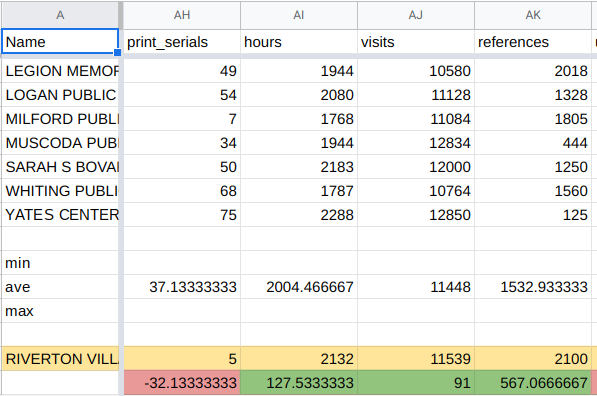
In the screenshot below, you can see that our target library is outperforming in hours open per year and references. Note that while we are "green," or above average, in the visits column, the value itself is small enough to be statistical noise -- it's important to look at the values themselve when performing this sort of analysis.
So how do we turn this sort of data into action? We need to look at our weaknesses, obviously, where we underperform our peers: how can we strengthen these areas, what challenges can we overcome? What lessons can we learn from our peer libraries that exceed the baseline on these benchmarks? Similarly, there are lessons to be learned from our strengths and successes as well: what are we doing right in these metrics that can be transferred to our weaker areas?
This sort of data analysis can be very informative and doesn't require advanced statistical skills to complete. It's a relatively straightforward process for people that are comfortable downloading and manipulating data, but you still might benefit from having a third-party assist you, to ensure objectivity and supplement your statistical and analytical operations. If so, feel free to get in touch with The Galecia Group!